A tour of the editor panels
site/media/lessons/editor-tour.lesson.ts (5 steps) A quick tour of the panels you use most. (The viewport, gizmo, and hierarchy have their own pages — see Viewport and Hierarchy & inspector.)
-
Open a scene in the editor. Load
examples/scenes/editor-tutorial.vscn.json.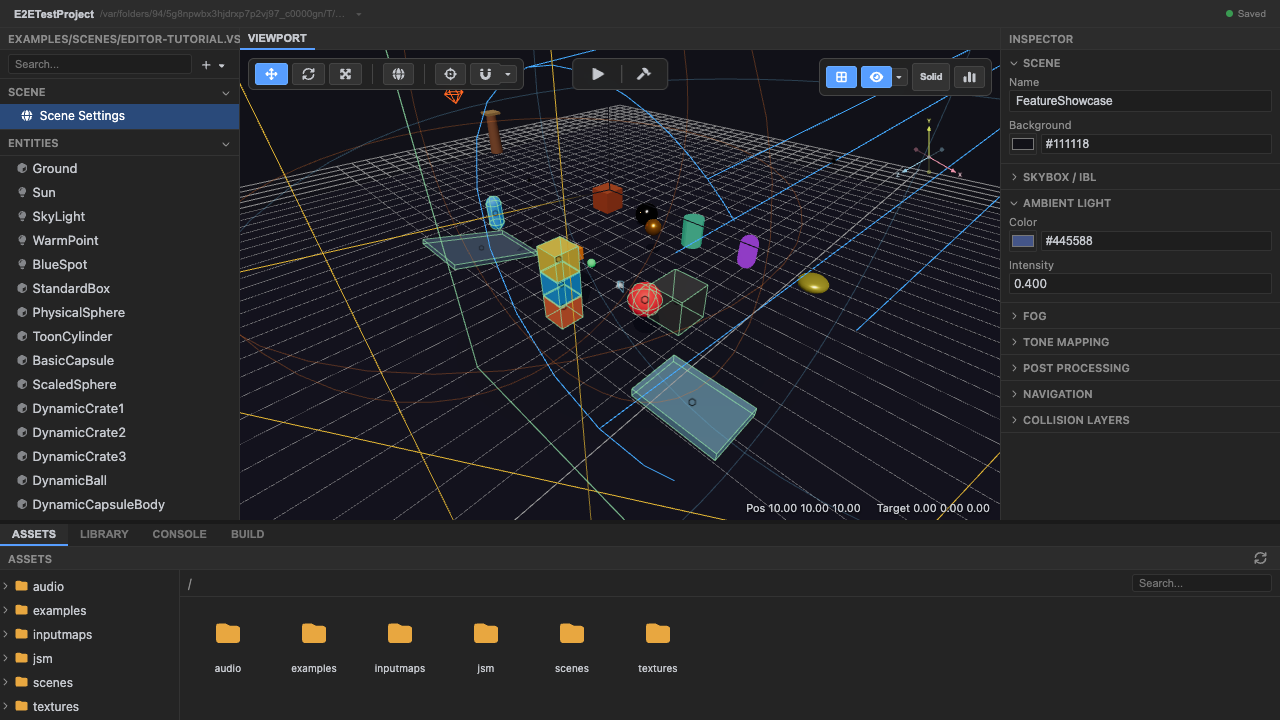
The editor with a scene loaded. -
Select an entity — the inspector shows its sections. Click an entity; the inspector (right) shows the sections it has (Transform, Mesh, Material, …), with fields generated from the engine’s Zod schemas.
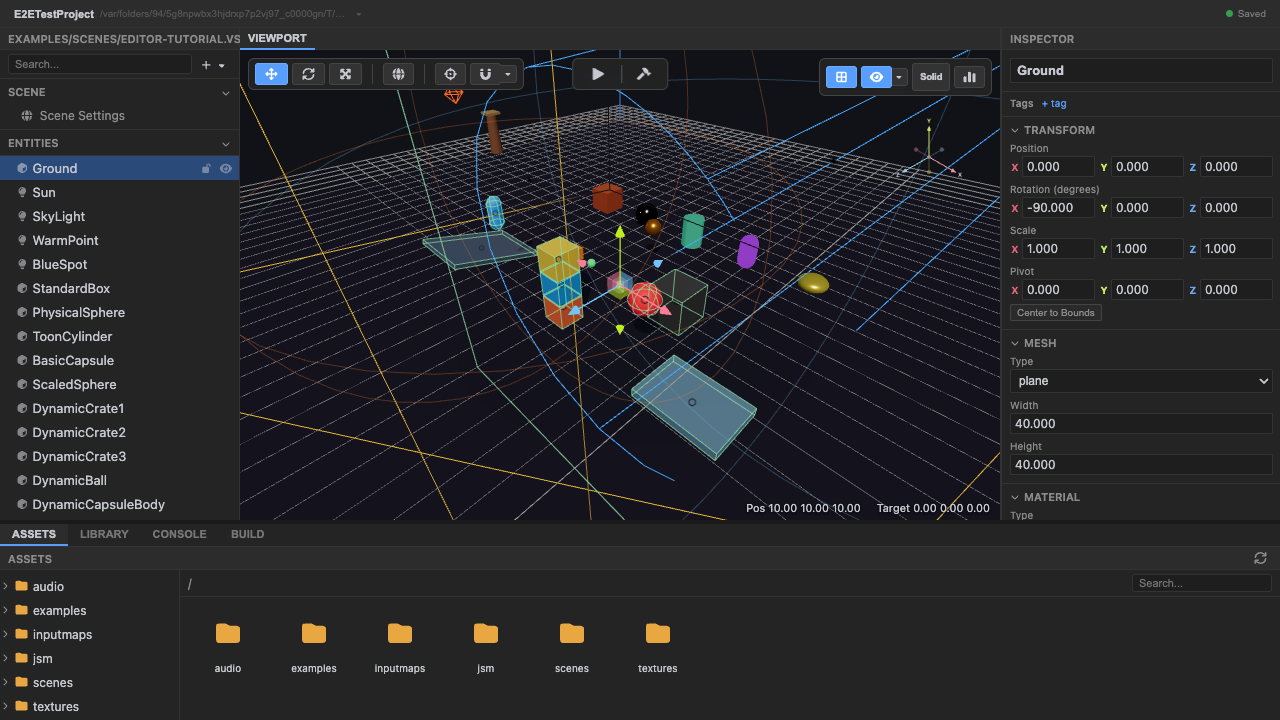
The inspector adapts to the selection. -
Open the Console tab to see engine logs. The bottom panel’s Console shows engine logs with level filtering — your first stop when something misbehaves.
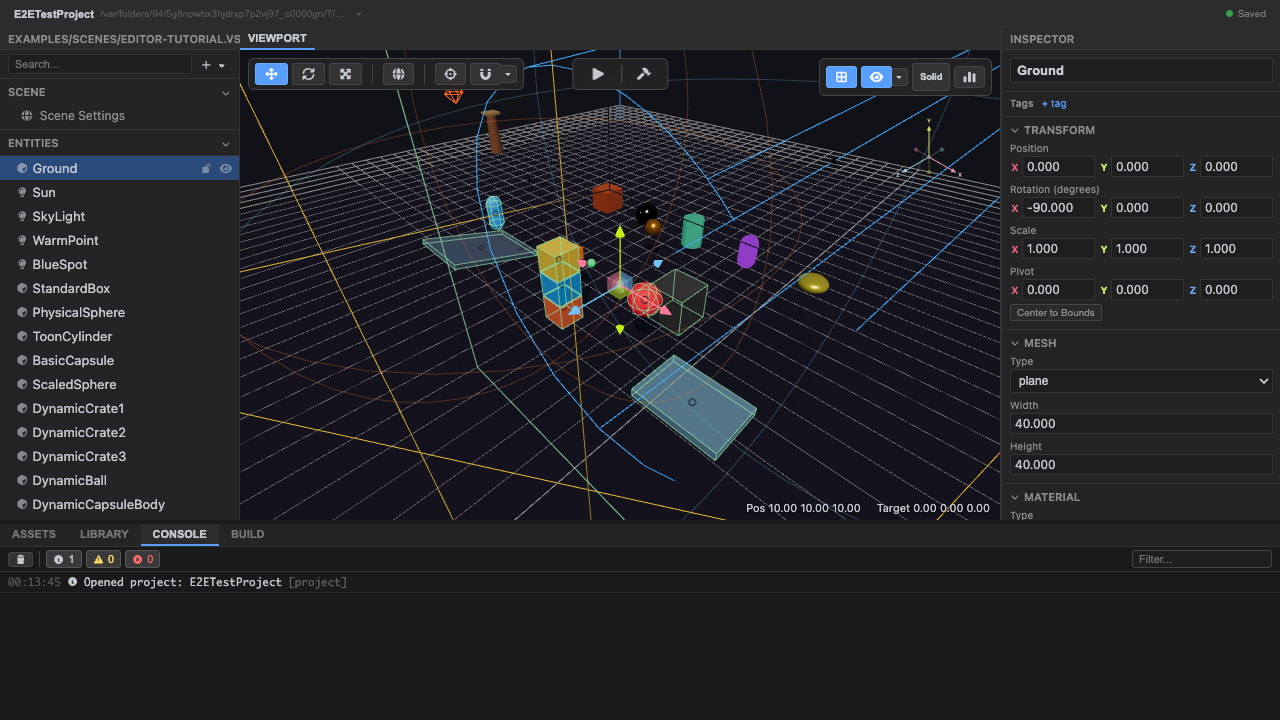
The console panel (engine logs). -
Open the Build tab to export the game. The Build panel exports a web build (HTML5 / itch.io) or a Steam-ready desktop build via the editor server.
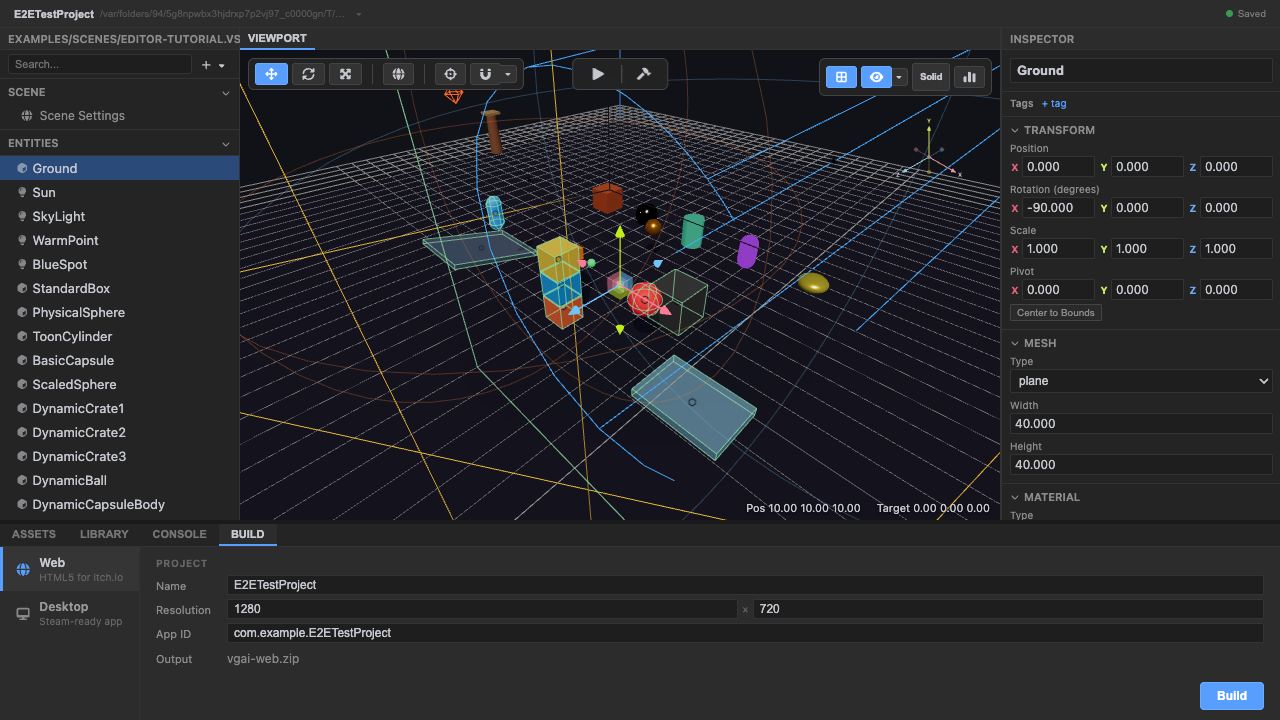
The build/export panel. -
Press
Ctrl+Kfor the command palette. A searchable list of editor actions (focus, save, play, view presets, …).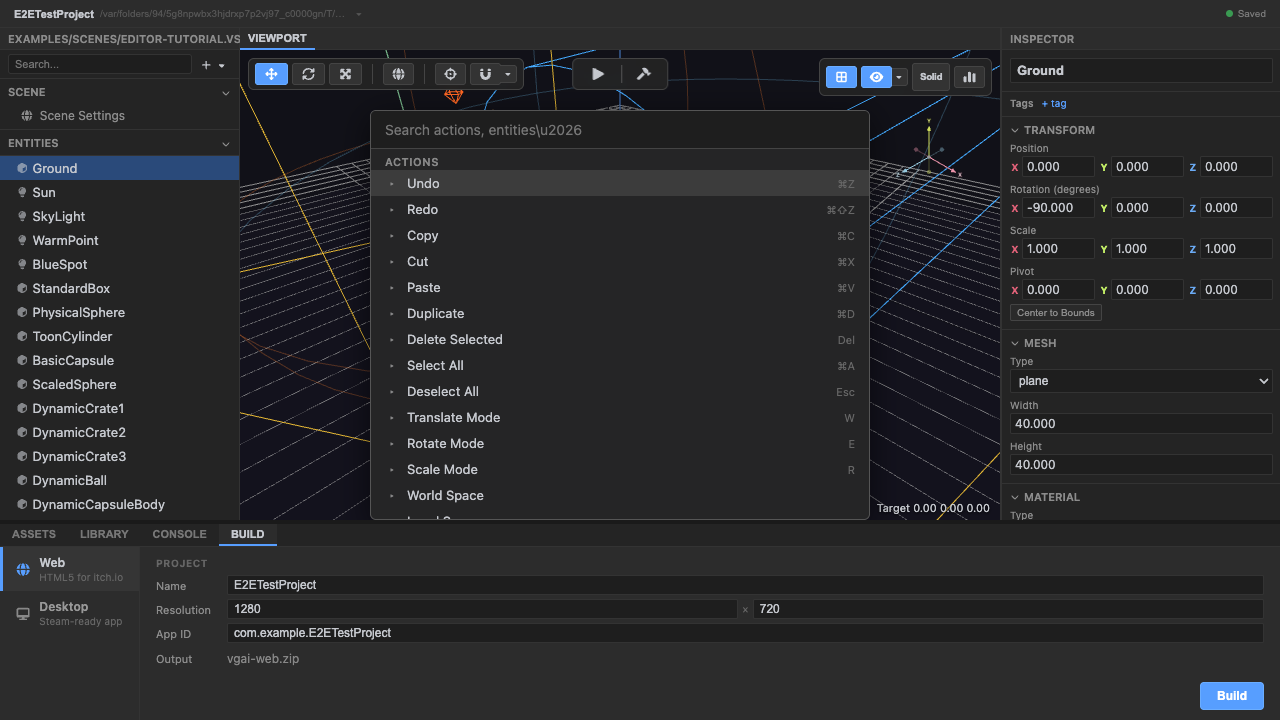
The command palette (Ctrl+K).
Recap
New functionality
- Read an entity's inspector sections
- Opened the console and build panels
- Opened the command palette
New concepts & skills
- The inspector is schema-driven (matches the runtime)
- The console shows engine logs with level filtering
- The build panel exports web/Steam; the palette (Ctrl+K) runs actions
Next lesson → Editor: assets, prefabs & ops